
Golf Club Distances for Beginners
There is no single required beginner golf-club distance: one published chart lists driver distances of 160–200 yd for men and 120–160 yd for women, with shorter ranges for irons and wedges. These reported ranges do not say whether they are carry or total distance. For club selection, measure your own representative carry distance (to first landing), record total distance (including roll) separately and examine the gaps between clubs.

PUBLISHED BEGINNER REFERENCE RANGES
Compare two golf clubs
Choose any two clubs to see their reported shot-distance ranges side by side. The figures are benchmarks, not beginner targets, and their carry-versus-total measurement basis is unspecified.
Driver
- Men — source category
- 160–200 yd≈ 146–183 m
- Women — source category
- 120–160 yd≈ 110–146 m
7-iron
- Men — source category
- 110–140 yd≈ 101–128 m
- Women — source category
- 70–100 yd≈ 64–91 m
For both source categories, these two published ranges do not overlap. That does not establish your personal distance gap.
Ranges reproduced from the 2025 Project Golf chart cited below. The men’s and women’s labels are the source’s categories, not ability standards. Metre equivalents are rounded (1 yd = 0.9144 m).
Golf club distance depends on the club’s characteristics, swing speed, strike quality and playing conditions. A club with greater distance potential can still travel less when contact is poor, while firm ground can add roll to total distance without increasing carry.
Two beginners using the same club may therefore hit different distances, even before wind, temperature and elevation are considered. Published ranges can orient expectations, but personal measurements provide a more useful baseline.
Table of Contents
Typical Golf Club Distance Ranges for Beginners
Typical golf club distance ranges for beginners are reference benchmarks, not performance requirements.
A beginner distance range can sit above or below these figures because player profile, strike quality, swing speed and conditions create substantial variability.
The illustration groups driver and woods, hybrids and irons, and wedges by their general long-to-short distance relationship without assigning fixed yardages.
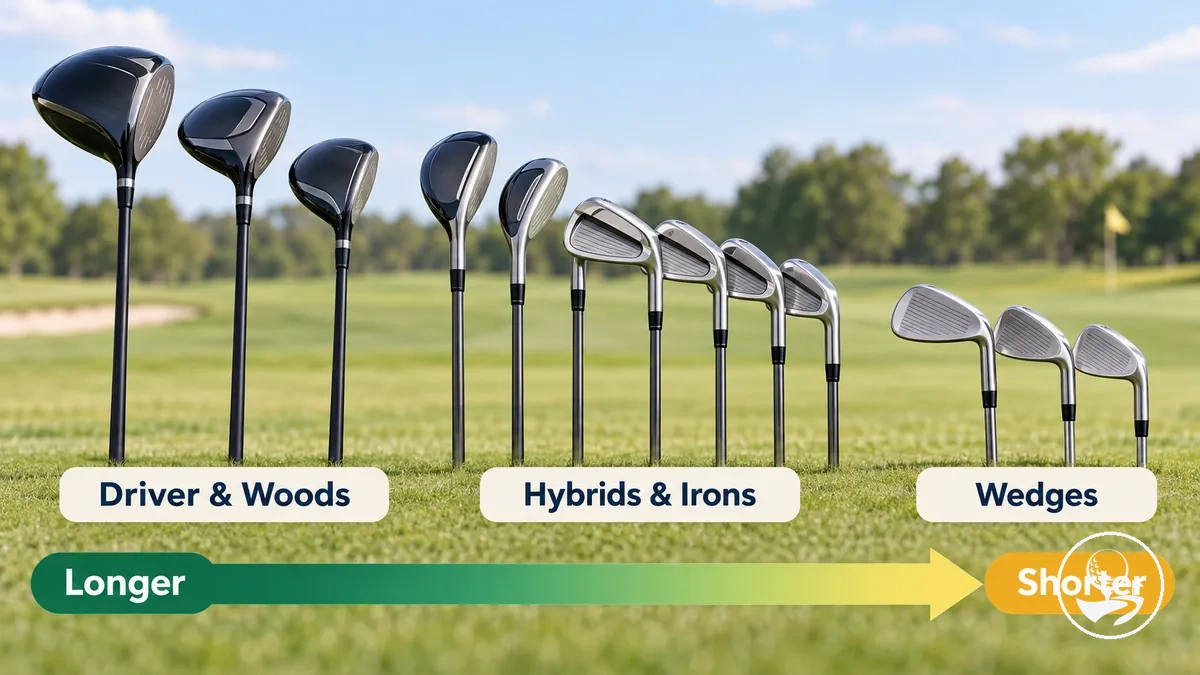
Project Golf's beginner club-distance chart, published in 2025, reports general ranges for male and female beginners across major clubs.
These published ranges do not identify carry or total distance. Read them as reported shot-distance benchmarks, not as verified carry distances or yardage requirements.
| Club or Club Group | Distance Basis | Typical Beginner Range | Important Qualification |
|---|---|---|---|
| Driver | Reported shot distance; carry versus total not specified | Men: 160–200 yd; women: 120–160 yd | Project Golf beginner range; individual results can fall outside the benchmark. |
| 3-Wood | Reported shot distance; carry versus total not specified | Men: 150–180 yd; women: 110–140 yd | Player speed and strike quality can change the observed distance. |
| 5-Wood | Reported shot distance; carry versus total not specified | Men: 140–170 yd; women: 100–130 yd | Use as a reference range rather than a required yardage. |
| 4-Hybrid | Reported shot distance; carry versus total not specified | Men: 130–160 yd; women: 90–120 yd | Personal distance may overlap with adjacent clubs. |
| 5-Iron | Reported shot distance; carry versus total not specified | Men: 120–150 yd; women: 80–110 yd | Club characteristics and strike consistency can shift the range. |
| 7-Iron | Reported shot distance; carry versus total not specified | Men: 110–140 yd; women: 70–100 yd | Published values provide context, not a competence standard. |
| 9-Iron | Reported shot distance; carry versus total not specified | Men: 90–120 yd; women: 60–85 yd | Individual measured distances can be shorter or longer. |
| Pitching Wedge | Reported shot distance; carry versus total not specified | Men: 80–100 yd; women: 50–75 yd | The range reflects general beginner expectations rather than a fixed target. |
| Sand Wedge | Reported shot distance; carry versus total not specified | Men: 60–80 yd; women: 40–60 yd | Full-shot results can vary with swing length and strike quality. |
The representative range generally decreases from driver and woods through hybrids and irons to wedges, but personal measured distances can overlap or fall outside these bands.
Use the benchmark to orient expectations, then compare it with your own consistently measured carry distance and total distance rather than treating the published ranges as a required standard.
Driver and Fairway Wood Distances
Driver and fairway wood distances usually step down from driver to 3-wood and then 5-wood, but the spacing is not fixed for beginners.
Slow-swing carry example
- Driver
- 180 yd
- 3-wood
- 165 yd
- 5-wood
- 150 yd
Cedarwood Golf’s category uses a driver swing speed below 85 mph. These are carry-distance examples for that category, not guaranteed beginner results. The illustration compares club length and head shape rather than measured yards.
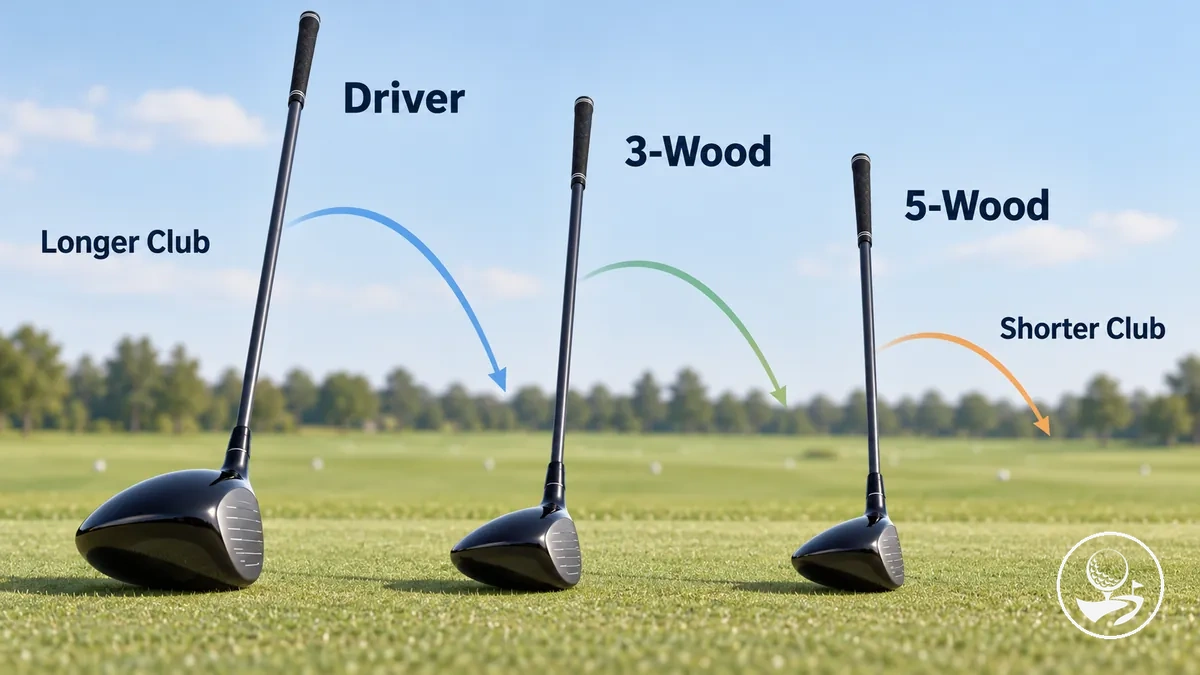
A driver typically combines lower loft with greater club length than a fairway wood, giving it greater theoretical distance potential, but the distance actually produced also depends on swing speed and strike quality.
Cedarwood Golf notes that greater swing speed generally produces more distance when contact remains solid, while loft differences can also change club distances.
A well-struck fairway wood can therefore overlap a poorly struck driver for a beginner, so individual strike quality can narrow or widen the expected spacing between these long clubs.
Hybrid and Iron Distances
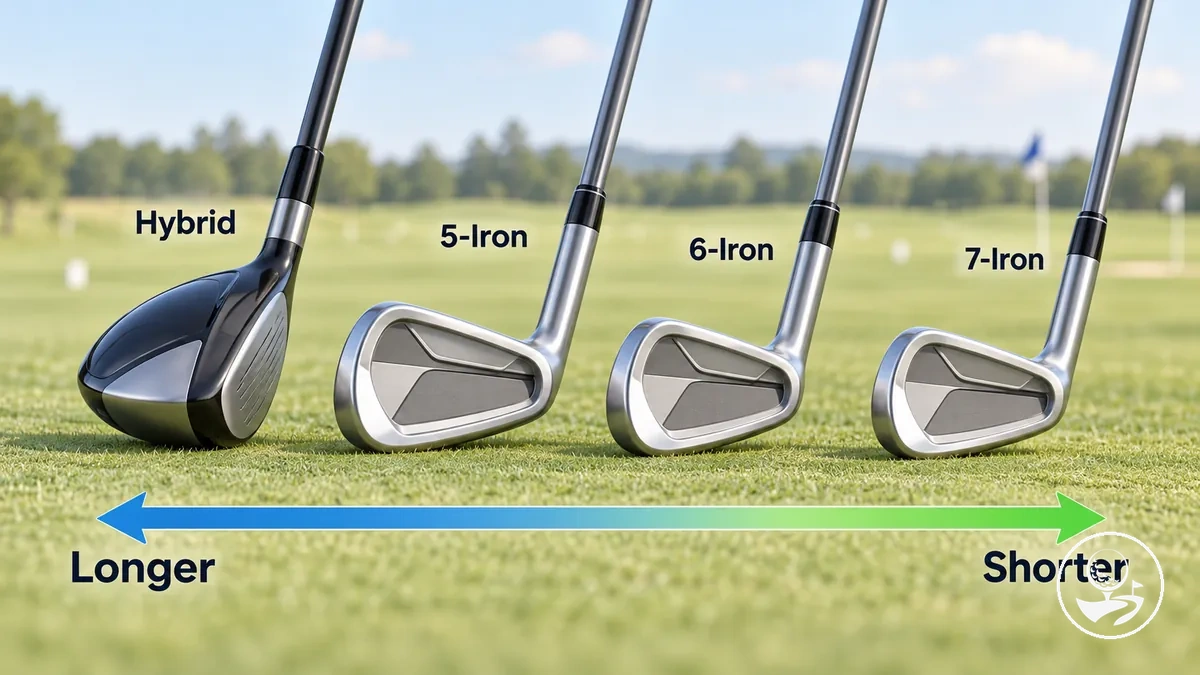
Hybrid and iron distances generally decrease as loft increases through the sequence, but the distance spacing is not fixed for beginners.
Project Golf's 2025 beginner chart places a 4-hybrid at 130–160 yd for men and 90–120 yd for women, compared with 120–150 yd and 80–110 yd for a 5-iron; the illustration shows this general progression while allowing for personal overlap.
Wedge Distances
Wedge distances generally shorten as loft increases, so a pitching wedge tends to have a longer full-swing distance than a gap, sand or lob wedge.
Mid-handicap full-swing carry examples
- Pitching wedge
- 110–135 yd
- Gap wedge
- 90–110 yd
- Sand wedge
- 75–95 yd
- Lob wedge
- 60–80 yd
Stix Golf’s reference is for mid-handicap players on full swings; it is not a beginner performance target or a partial-shot chart.
The illustration shows this increasing-loft, shorter-flight relationship without assigning a universal yardage.
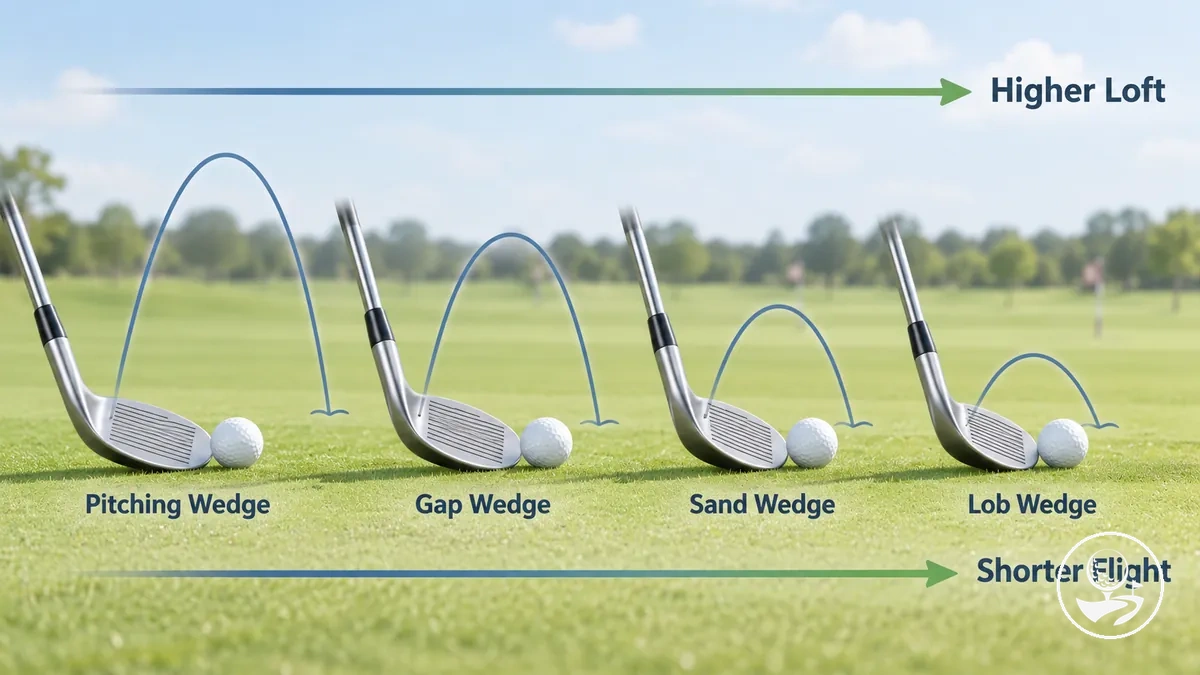
Increasing loft generally produces a shorter full-swing carry, but actual wedge distance also changes with strike quality and swing length.
Stix Golf notes that slower swings can carry about 10–20 yd shorter per wedge than its mid-handicap reference, while Golfwell likewise identifies loft, contact and different swing lengths as factors in personal wedge yardage.
These figures describe full-swing distance; partial shots around the green use different swing lengths and should not be treated as the same distance measure.
For a beginner, the useful distance range is therefore the one produced by their own wedges and consistent full swings, not a universal wedge number.
Carry Distance vs Total Distance
Carry distance and total distance are two measurements of the same golf shot: carry distance ends when the ball first reaches its landing point, while total distance continues through bounce and roll to the final stopping point.
The diagram separates the airborne portion from the post-landing roll so the two measurement boundaries are clear.
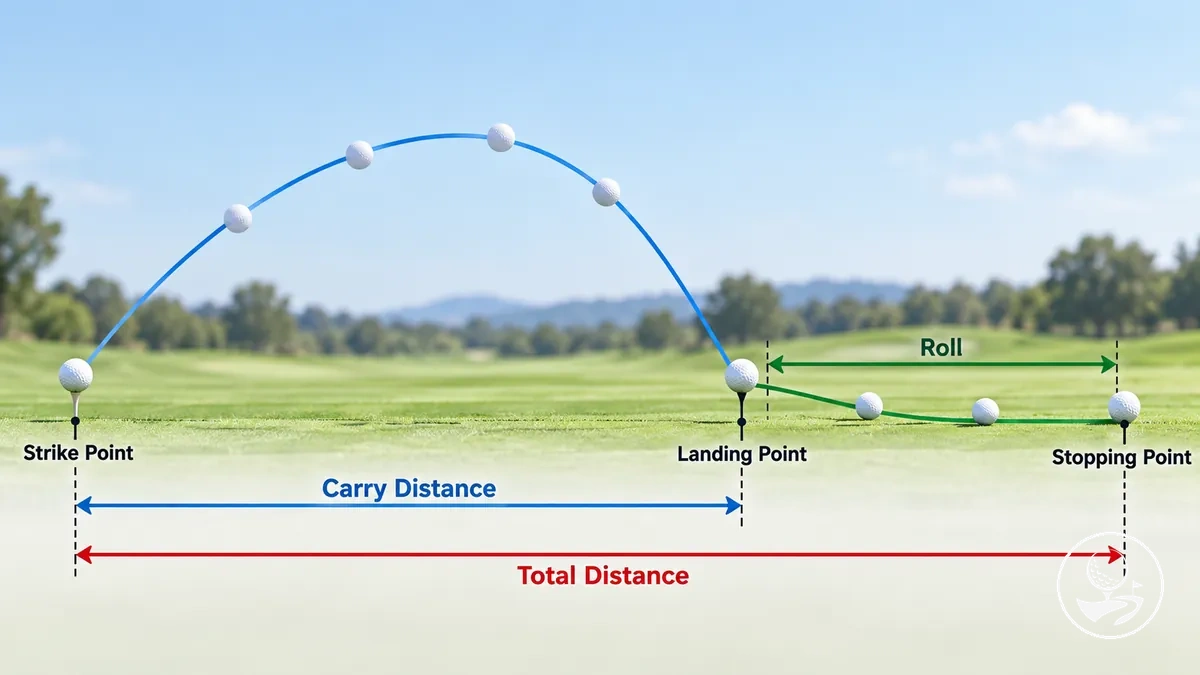
TrackMan defines carry distance as the distance the ball travels through the air and total distance as the full shot distance including roll.
TrackMan identifies ball speed, launch angle and spin rate as primary influences on carry, while its total-distance calculation also accounts for landing angle, landing ball speed and spin rate.
Ground conditions such as surface firmness can change the amount of roll after landing, so the difference between carry distance and total distance is not fixed.
| Measurement | Where It Ends | Main Influences | Why It Matters |
|---|---|---|---|
| Carry Distance | At the landing point, before bounce and roll | Ball speed, launch angle, spin rate and airborne conditions | Shows the airborne portion of shot distance without including ground response |
| Total Distance | At the final stopping point after landing, bounce and roll | Carry plus landing angle, landing ball speed, spin and ground firmness | Shows the overall distance while accounting for post-landing movement |
For example, two shots can have the same carry distance and reach the same landing point but finish at different total distances when the ground conditions differ.
Softer ground can limit bounce and roll, while firmer ground can allow more rollout; the carry measurement still ends at landing in both cases.
Keeping carry distance and total distance separate therefore makes a reported golf-club distance easier to interpret.
Why Golf Club Distances Vary
Golf club distance variation is multi-factorial: the distance produced by a shot reflects the golfer, the club and the environment rather than one fixed property of the club.
Swing speed may contribute to distance differences, but strike quality, club specifications and playing conditions can influence the result at the same time.
The causes can be separated into three classes so that distinct mechanisms and conditions are not mistaken for one another.
PGA TOUR Superstore identifies player variables such as swing speed and contact, alongside club variables including loft, shaft length and clubhead design.
Hireko Golf also notes that wind, elevation and ground conditions can change carry or roll, supporting the environment as a separate cause class.
- Player: Swing speed, strike quality and delivery contribute to the distance produced from a given club.
- Club: Club specifications such as loft, length and design influence distance tendency, with the observed effect depending on how the golfer delivers the club.
- Environment: Wind, elevation and ground conditions can change carry or roll, so shot distance can differ even when the golfer and club remain the same.
These three cause classes can interact, so an observed distance change should be interpreted conditionally rather than assigned to one variable in isolation.
For example, a difference in loft may change the expected result, while strike quality and environmental conditions can strengthen, reduce or obscure the distance difference actually observed.
Swing Speed and Strike Quality
Swing speed and strike quality work together to influence the distance produced with a given club, so neither should be interpreted in isolation.
Speed creates potential; contact converts it
- Swing speed
- Greater speed can increase distance potential when contact remains solid. WSOC-TV links useful distance to speed paired with good impact and launch.
- Strike quality
- At similar effort, centred contact can produce more effective ball speed and launch. Loop 19 notes that off-centre strikes reduce energy transfer.
If contact worsens as speed increases, distance can shorten or vary more, even with substantial clubhead speed.
Club Loft, Length and Design
Club loft, length and design are separate specifications that can influence launch, speed potential, distance and consistency.
Loft describes the clubface angle, club length describes the overall club length, and design includes characteristics such as head geometry and weight distribution.
Mitchell Golf notes that increasing loft generally raises launch and can reduce horizontal distance, while the loft presented at impact also depends on player delivery.
The distance implication of each specification is conditional rather than fixed.
GolfWorks identifies loft and club length as important specifications behind distance differences between clubs, although the outcome still depends on how the golfer delivers and contacts the club.
Hireko Golf explains that design characteristics such as moment of inertia can affect energy retention on off-centre contact, which can influence distance consistency.
These mechanical tendencies describe distance potential rather than guaranteeing the same outcome for every golfer.
- Loft: More loft tends to increase launch and reduce horizontal distance, while lower loft can provide greater distance potential when the golfer can produce suitable speed and contact.
- Club length: Greater club length can increase speed potential, but the resulting distance depends on maintaining effective contact and delivery.
- Design: Head geometry and weight distribution can influence launch characteristics and how much ball speed is retained on off-centre strikes, affecting consistency without guaranteeing a fixed distance result.
Weather, Elevation and Ground Conditions
External playing conditions can change the observed distance of a golf shot even when the golfer and club remain the same.
Wind, temperature and elevation can alter ball flight, while ground firmness can change what happens after the ball lands.
Flight-related conditions primarily influence carry distance, whereas landing-surface conditions primarily influence roll and therefore total distance.
The size of each effect depends on the actual conditions and the shot, so these influences are directional rather than fixed yardage adjustments.
- Wind: Wind direction and strength can change ball flight and carry. TrackMan reports that shots into a headwind lose carry while a tailwind can add carry, with the magnitude depending on the shot rather than following one universal adjustment.
- Temperature: Titleist explains that colder air is denser than warmer air, increasing aerodynamic forces on the ball and tending to shorten carry distance. Warmer air can therefore support more carry under otherwise comparable conditions, although the amount varies.
- Elevation: Higher elevation reduces air density, so the ball experiences less aerodynamic drag and can travel farther through the air. Titleist notes that the resulting distance change varies with the golfer, club and launch conditions rather than applying equally to every shot.
- Ground firmness: Firmer ground can allow more bounce and roll after landing, increasing total distance without necessarily changing the preceding carry distance. USGA research found that softer fairway conditions reduce driving distance relative to firmer fairways because post-landing behaviour changes.
How to Measure Your Own Golf Club Distances
Measure personal golf club distances from repeated representative shots taken under reasonably consistent conditions, rather than from one unusually long strike.
The aim is to turn repeated measurement into a usable baseline for each club.
Keep the testing environment as consistent as practical so that changing conditions do not dominate the results.
Use repeated shots with each club because a one-shot measurement cannot show the normal variation in your distance.
- Establish consistent conditions: Test from the same general location and use comparable balls and conditions where practical. Record any material wind, temperature or surface differences that could affect the measurement.
- Hit repeated shots with each club: Collect a sample of normal swings rather than judging the club from its longest shot. Repeated shots provide a better basis for identifying a representative result than one exceptional strike.
- Record carry and total separately: Note carry distance and total distance as separate values wherever the measurement method provides both. A launch monitor or measured range can provide carry information, while GPS or on-course measurement can help record overall shot distance.
- Identify obvious mishits: Separate usable representative shots from a clear mishit that does not reflect your normal contact. Annotate or exclude obvious outliers consistently rather than removing ordinary shorter shots simply because they reduce the result.
- Derive a representative value: Use the remaining repeated shots to calculate or select a central, representative value for each club. Golfers Authority advises using an average after excluding outliers rather than treating the longest shot as the normal distance.
- Record the result: Store the representative carry distance and total distance, where available, for each club together with the measurement conditions. GPS shot-tracking systems can also build measured club-distance records over time from on-course shots.
- Verify and repeat when needed: Before using the value, confirm that it reflects repeated normal shots rather than one exceptional result or a cluster of mishits. Repeat the measurement when technique, equipment or conditions materially change.
Re-measurement keeps personal club distances representative of current performance rather than an outdated baseline, so treat each stored value as a working measurement rather than an immutable figure.
Understanding Distance Gaps Between Clubs
Club gapping is the difference between the reliable distances produced by adjacent clubs, usually compared using representative carry distance.
The distance gap between each pair shows how evenly a golfer's personal distances provide coverage rather than how far any one club can travel on its longest shot.
Representative distances matter because an isolated maximum can exaggerate the spacing between adjacent clubs.
Mike Lavers PGA Professional notes that carry consistency and the gaps between clubs matter alongside the distance number itself.
The illustrative values below show how the same comparison can reveal clear separation in one club pair and meaningful overlap in another; they are examples rather than target yardages.
| Club Pair | Representative Carry Distances | Gap | Interpretation |
|---|---|---|---|
| 6-iron / 7-iron | 145 yd / 133 yd | 12 yd | Clear separation in this illustrative personal distance pattern. |
| 7-iron / 8-iron | 133 yd / 122 yd | 11 yd | Similar spacing continues through the next adjacent pair. |
| 8-iron / 9-iron | 122 yd / 119 yd | 3 yd | Narrow spacing may indicate meaningful overlap if the golfer's normal shot variation is similar to or greater than the gap. |
A consistent gap pattern shows where adjacent clubs provide distinct reliable distances, while narrow spacing or overlap may reveal areas where coverage is less distinct.
Whether a particular distance gap is useful depends on the golfer's own representative carry distances and normal variation; no single gap size is universally correct.
Typical Distance Gaps Between Consecutive Clubs
Distance gaps between consecutive clubs usually form a personal pattern rather than one universal interval.
PCCWGL's published amateur distance chart illustrates that spacing between adjacent clubs is not identical across club positions or player-distance profiles, so gap size is better interpreted from representative carry distance and personal distance measurements than from a prescribed number.
What changes the gap between neighbouring clubs?
- Loft progression
- The difference in loft can widen or narrow the flight and distance separation between clubs.
- Swing and ball speed
- Limited speed separation can compress gaps; Titleist fitting material shows neighbouring clubs with similar distances when ball-speed separation is small.
- Contact consistency
- Repeatable strikes can reveal steadier spacing, while variable contact can make the carry gaps uneven.
Judge the pattern in your own representative carry distances; an identical gap size is not mandatory across every club pair.
When Clubs Produce Similar Distances
Repeated similar club distances can have several explanations, so distance overlap does not by itself prove an equipment problem.
The same signal may reflect inconsistent strike, limited speed separation between adjacent clubs, or closely spaced effective loft at impact.
Use repeated shots as the diagnostic basis rather than interpreting one unusually long or short result.
Compare the pattern of carry distances, contact quality and launch behaviour across the affected clubs; each diagnostic check should make one interpretation more or less plausible without treating it as automatic confirmation.
- Inconsistent strike: If the distance overlap appears alongside large shot-to-shot variation, inconsistent strike may be reducing the reliable separation between clubs. Check whether repeated shots show variable contact and carry; overlap that becomes smaller on consistently struck shots supports contact variation as a possible cause.
- Limited speed separation: If adjacent clubs produce similar distances even when contact is reasonably consistent, insufficient speed separation may be contributing to the narrow gap. Check whether repeated shots show little change in ball speed or carry between the clubs; MyGolfSpy notes that reduced ball-speed separation can accompany compressed iron distances.
- Similar effective loft: If repeated shots launch on similar trajectories despite using different clubs, closely spaced effective loft at impact may be contributing to the overlap. MyGolfSpy describes added loft at impact as a factor that can compress iron distances, so compare launch and delivered-loft information where available; one overlapping result alone does not establish this or any other cause.